
Chart of Accounts in SAP Business One - Chart of Accounts Concepts
In this session, we will discuss the chart of accounts structure and the effect of standard processes on the Chart of Accounts in SAP Business One.
I/ Business Scenario
Imagine that you are implementing SAP Business One at a new customer.
- You discuss with Maria, the accountant, the effect of the sales and purchasing processes on the chart of accounts, and as a result, on the financial reports.
- Maria says that this structure will help her in presenting the financial reports in a clear and structured way.
II/ Reflection Question: The Chart of Accounts
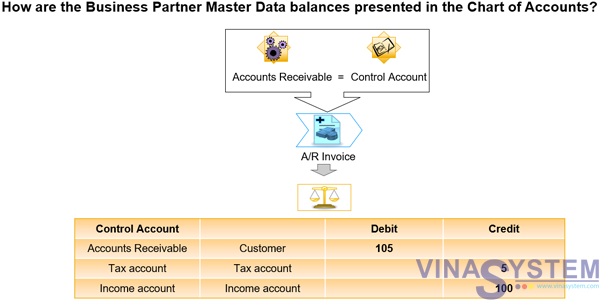
How are the Business Partner Master Data balances presented in the Chart of Accounts?
The Business Partner Master Data balances do not appear in the Chart of Accounts.
The receivable and payable control accounts accumulate the customer and vendor transactions in their balances.
For example, when you post an A/R invoice, the accounts receivable account related to the customer is used, in addition to the customer account.
Therefore, the Chart of Accounts presents the complete financial status of the company, as well as the Financial Reports (for example, Trial Balance and Balance Sheet).
1/ The Chart of Accounts
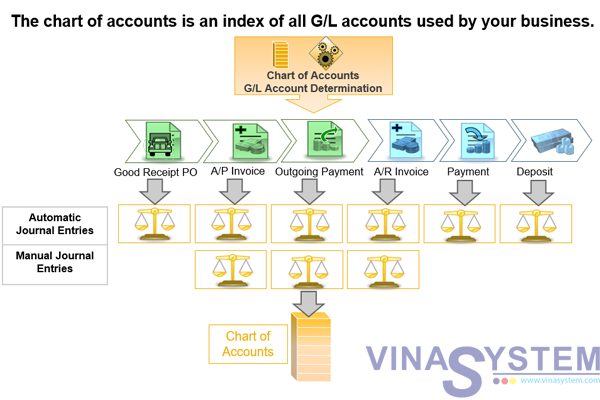
The chart of accounts is an index of all G/L accounts used by your business.
Every G/L account has:
- An account code
- An account description, and
- Additional information that determines the functions of the G/L account.
When you implement SAP Business One you define (or import):
- The Chart of Accounts, and
- Default G/L accounts to be used when transactions are created in the regular business processes: Sales, Purchasing, Inventory and more.
The documents in the Sales and Purchasing processes create automatic journal entries that are registered in the Journal Entry file and affect the account balances.
The account balances are also affected by manual journal entries and other accounting transactions, such as the Period End Closing process that transfers the balances of the Profit and Loss accounts to a Balance Sheet account.
IV/ Chart of Accounts Structure
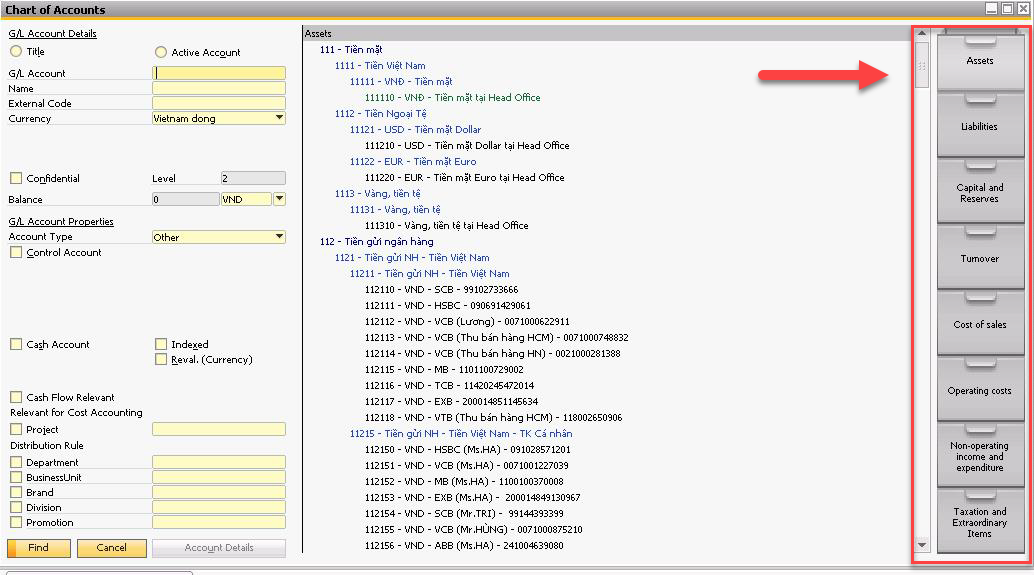
The Chart of Accounts is organized by drawers and levels.
Let us look at this example of a Chart of Accounts. The chart of accounts varies according to the company’s localization.
The organization of the chart of accounts follows Generally Accepted Accounting Principles.
The Chart of Accounts window organizes your accounts by drawers.
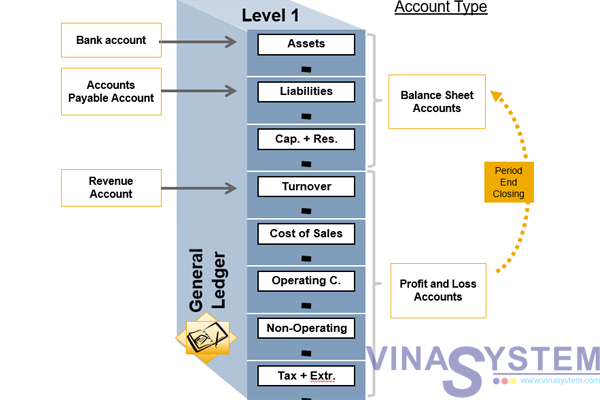
In the General Ledger, we distinguish between Balance Sheet Accounts and Income Statement Accounts, also called Profit and Loss Accounts.
Let us start with Balance Sheet Accounts:
- The first 3 drawers: Assets, Liabilities, and Equity (or Capital and Reserves) hold the Balance Sheet Accounts, such as the Sales Tax account and the Accounts Payable Account.
- The bookkeeping balance of these accounts is kept from one fiscal year to the next.
- The Balance Sheet Accounts – reflect the monitory value of the company - stock, assets, debt, etc.
Next, we have the Profit and Loss Accounts:
- The last 5 drawers: Revenues (or Turnover), Cost of Sales, Expenses (or Operating Costs), Financing (or Non-Operating Income and Expenditure), and Other Revenues and Expenses (or Taxation and Extraordinary Items) hold the Profit and Loss Accounts, such as the Income Accounts. Note that in some localizations, the lower drawers are not all profit and loss account drawers.
- The bookkeeping balance of these accounts has to be cleared at the end of each fiscal year during the Period End Closing process.
- The Profit and Loss Accounts reflect the changes in the company value, such as: when you sell stock – the cost of goods sold account is affected and increases revenues.
V/ Chart of Accounts Structure in Association with Financial Reports
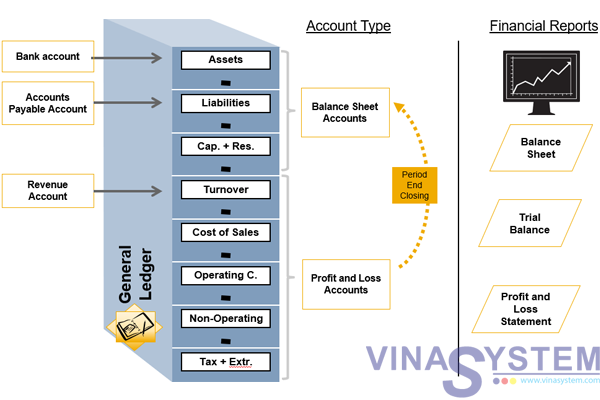
Financial reporting requirements drive most of the initial settings and configuration decisions in the chart of accounts.
The different financial reports run on the account balances relevant to a selected date range and present them according to their drawer, level and type:
- The Balance Sheet summarizes the value of the business’ assets liabilities, and owner’s equity accounts.
- The Trial Balance displays for each account: beginning balance for a particular period, all of the debits and credits, and the ending balance.
- The Profit and Loss Statement is determined after the end of the fiscal year. The balances of the expense accounts will be subtracted from the balances of the revenue accounts to come up with the profit or the loss for the fiscal year.
VI/ Levels in the Chart of Accounts
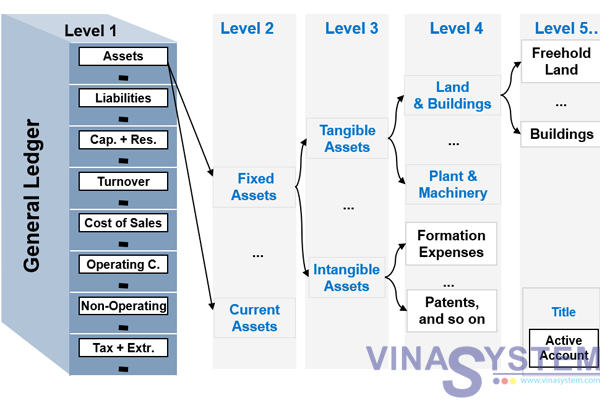
A chart of accounts arranges a company's general ledger accounts in a hierarchical structure. The top level in the structure (level 1) consists of sections or groups for different type of accounts (assets, liabilities, capital and reserves, turnover, and so on). The number of account groups depends on the localization that was selected when the company was created and cannot be modified by the user.
The system displays the section as a cabinet drawer. Each drawer has a section title. You can change the drawer title if required. The updated name will then appear in the financial reports.
You can define up to 10 levels. While level 1 is the drawer level, the following levels can be used as titles for grouping the accounts and for active accounts.
Organize your accounts by level in a logical fashion appropriate to your localization’s financial accounting and reporting processes.
The system displays lower-level titles in blue and normal active accounts in black. Accounts that you have entered in the G/L Account Determination (default accounts) are displayed in green.
Let us look at this specific example of Chart of Accounts that contains 5 levels:
Levels 2 through 4 can contain either active accounts or titles that combine several active accounts. Level 5, in this example, contains only active accounts.
Because only active accounts can be posted to in SAP Business One, it is a good practice to have all your active accounts at the same level.
In reports, a title account summarizes all the balances of each active account below it.
VII/ Summary
Here are some key points to take away:
- We distinguish between two types of accounts: balance sheet accounts and income statement accounts. Income statement accounts are also called Profit and Loss accounts.
- The different financial reports run on the account balances relevant to a selected date range and present them according to their drawer, level and type.
- A chart of accounts arranges a company's general ledger accounts in a hierarchical structure: the top level in the structure (level 1) consists of sections or groups for different type of accounts. The system displays the section as a cabinet drawer.
- The following levels can be used as titles for grouping the accounts and for active accounts. Only active accounts can be posted to in SAP Business One.
Categories
Related News

Sep 19, 2017

Jan 29, 2018

Feb 10, 2025

Jun 29, 2017

Sep 20, 2017
